





Trade in urea and phosphate fertilizers has been severely disrupted by the conflict in the Persian Gulf, according to data analysed by the WTO Secretariat. Certain economies in Africa and Asia are particularly vulnerable to resulting fertilizer shortages and price hikes. Opening of the Strait of Hormuz – a key channel for fertilizer trade – will in due course contribute to easing trade frictions and restore stability to global markets.
What happened – and why does it matter?
The outbreak of the conflict in the Persian Gulf in February 2026 has severely disrupted global trade. Fertilizer trade has been among the sectors most affected. With fertilizers (see Box 1) among the critical inputs farmers rely on for production, the disruption has raised concerns that farm yields could be compromised, with potential knock-on effects for food prices and global food security.
|
Box 1: Fertilizers are key to supporting farm productivity Nitrogen, phosphorus and potassium are primary nutrients, each with a specific role: nitrogen drives vegetative growth, phosphorus supports roots and reproduction, and potassium improves overall plant health and resistance. Nitrogen fertilizers, such as urea and ammonium nitrate, are closely linked to energy markets since ammonia production relies on natural gas as both feedstock and fuel. Phosphate and potash fertilizers are less directly exposed to gas prices but depend on mining activities to extract phosphate rock and potash, and production is concentrated in a small number of economies. Sulphur is considered as a major secondary nutrient and plays a pivotal role in the production of phosphate fertilizers. |
How has the Gulf conflict affected fertilizer markets?
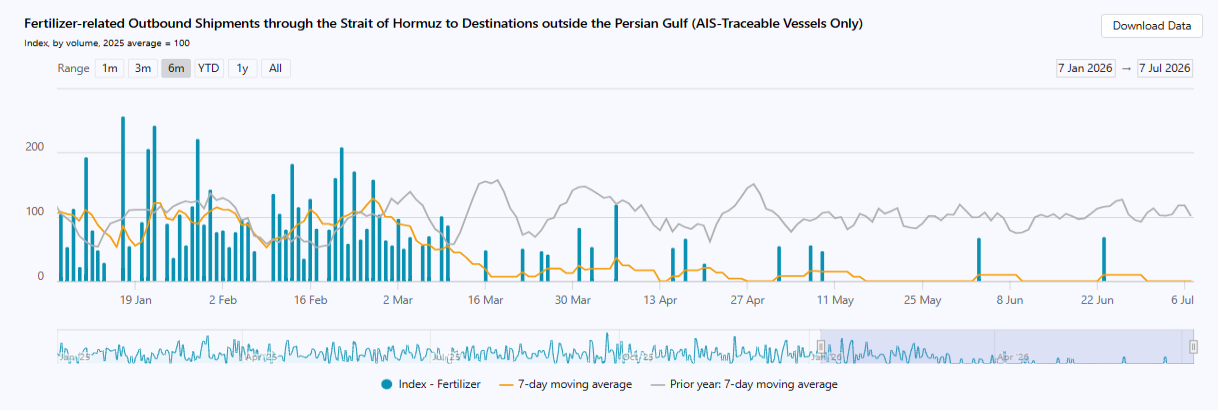
Figure 1 shows that outbound fertilizer-related shipments through the Strait of Hormuz to destinations outside the Persian Gulf came to a standstill once the conflict started – and have remained close to zero since then. A stable resumption of shipments still remains to be seen.
Figure 1: Fertilizer shipments through the Strait of Hormuz have reached a standstill
Source: Data Lab OMC
Note: Vessels that have disabled automatic identification systems (AIS) are not included.
Figure 2 shows that urea prices have almost reverted to pre-war levels, after doubling following the outbreak of the conflict. In April 2026, urea prices rose from around US$ 400 per metric ton (mt) to over US$ 850/mt in April 2026, before falling again to US$ 453/mt in June. Diammonium phosphate (DAP) prices also increased substantially after the outbreak of the conflict, climbing from approximately US$ 580/mt to around US$ 770/mt. However, these increases still remain below the peaks recorded in 2022 following the outbreak of war in Ukraine, when urea briefly exceeded US$ 900/mt, DAP approached US$ 960/mt, and potash surpassed US$ 1,200/mt. Further price developments may depend on progress implementing the agreement to reopen trade in the Strait of Hormuz.
Figure 2: Urea and phosphate prices have spiked since the outbreak of the conflict 
Source: World Bank
How important are Gulf region economies for fertilizer markets?
Figure 3 shows that global fertilizer exports are highly concentrated in a small number of suppliers.
Gulf region economies1 supplied 24.8% of global nitrogenous fertilizer exports and 11.4% of phosphatic fertilizer exports, while their presence in potash trade is negligible. Asian economies represent 40% of nitrogenous fertilizers exports from the Gulf region and half of the region’s phosphatic exports (48%) were shipped there. Other major suppliers of nitrogenous and phosphatic fertilizers are the Russian Federation, China and Morocco.
Figure 3: Fertilizer supplies are concentrated in relatively few major exporters
Major fertilizer exporters’ market share by destination, 2024
Source: OMC
Note: The figure above shows exports related to the three main plant nutrients: nitrogen (N), phosphate (P2O5) and potash (K2O), with trade values allocated using the weights in Annex Table A1. Each horizontal bar represents one exporting economy or group of economies, with Gulf region economies grouped together. The coloured segments show how that exporter’s shipments are distributed across importing regions: the percentages inside the bar refer to the share of that exporter’s sales going to each region, while the values in parentheses report the corresponding trade value. The bold labels at the end of each bar report the exporter’s share of world exports in that nutrient-related category and the corresponding export value. “Others” aggregates all remaining exporters not shown separately. Sulphur exports, and the indirect effects of the conflict on natural gas exports, are not presented here.
How exposed are economies to fertilizer disruptions in the Gulf?
Figure 4 shows that the fertilizer imports of some economies are particularly exposed to disruptions in the Persian Gulf. India sourced almost two-thirds of its nitrogenous fertilizer imports from the region, while Thailand sourced close to half. Other significant destinations are Australia, Brazil, Morocco and the United States.
Figure 4: Some importing economies are particularly exposed to fertilizer disruptions in the Gulf region
Major fertilizer importers’ world shares by nutrient group, 2024
Source: OMC
Note: Trade values are allocated using the weights in Annex Table A1. Each horizontal bar represents one importing economy or group of economies. The coloured segments show how major importers source across regions, with Gulf region economies treated as a single source region. Percentages inside the bar refer to the share of the importer’s purchases supplied by each region, while values in parentheses report the corresponding trade value. The bold labels at the end of each bar report the importer’s share of world imports in that nutrient category and the corresponding import value. “Others” aggregates all remaining importing economies not shown separately. Sulphur exports, and the indirect effects of the conflict on natural gas exports, are not presented here.
How vulnerable are economies to disruptions in fertilizer trade?
Vulnerability to disruptions also depends on the share of fertilizers covered by imports. Some economies import small quantities in absolute terms but rely heavily on foreign supplies to meet fertilizer needs.
Figure 5 shows that 18 economies – in the upper-right quadrant – are particularly exposed to nitrogenous fertilizers supply disruptions in the Gulf. These economies, which constitute around one-fifth of the 81 economies of those that import from the Gulf region, combine high import dependence with strong reliance on Gulf suppliers.2
This group includes developing economies in Africa, such as Kenya, Malawi, Mozambique, Rwanda, South Africa, Tanzania, Uganda and Zimbabwe. It also includes Brazil, Nepal and Sri Lanka. Seven countries in this group are least developed countries (LDCs).
Figure 5: Eighteen economies are particularly vulnerable to nitrogen fertilizer disruptions in the Gulf
Note: The horizontal axis shows net imports as a share of domestic consumption of nitrogenous fertilizers, averaged over 2021-2023 (latest year available). Economies to the right rely more heavily on imports, while negative values indicate net exporters. Values above 100% may reflect stock rebuilding or re-exports of processed fertilizers not captured within the nitrogenous fertilizer category. The vertical axis shows the share of nitrogenous fertilizer imports sourced from Gulf region economies, averaged over 2021-2024. The bubble size represents total nitrogenous fertilizer imports, averaged over 2021-2023, in tonnes. The dashed lines indicate simple averages across the economies shown in the figure. The “World” marker reports the corresponding volume-weighted share, calculated as total nitrogenous fertilizer imports from Gulf region economies divided by total nitrogenous fertilizer imports. Economies in the upper-right quadrant, shown in red, combine above-average import reliance with above-average sourcing from the Gulf region. The numbers in the corners report the number of economies in each quadrant.
How have export restrictions affected global markets?
Since the closure of the Strait of Hormuz, export licences, restrictions and bans have further tightened global markets for fertilizers. Figure 6 shows the share of global fertilizer trade covered by these measures spiked sharply in 2026. These measures could affect up to 15% of world exports, in comparison to a reference period prior to the closure of the Strait.
Figure 6: Export restrictions have affected up to 15% of global fertilizer trade following the outbreak of the conflict in the Gulf 
Source: OMC & WTO Trade Monitoring Database
If the closure of the Strait is considered as de facto restricting all fertilizer exports from the Gulf region economies, the share of affected trade rises to 23.3%.
In practice, the actual reduction in exports is likely to be lower. Export licensing requirements, for example, do not amount to a complete export ban. The 23.3% estimate should therefore be interpreted as an upper limit for potentially affected exports rather than as a measure of actual trade losses. Moreover, some shipments have continued through alternative routes, including Saudi exports via the Red Sea port of Yanbu, but significantly higher costs and logistical constraints mean that these have been unable to match typical export volumes.
Since the outbreak of the conflict, policy monitoring by the inter-agency Agricultural Market Information System (AMIS) has pointed to several measures affecting both fertilizers and key fertilizer inputs. These vary in scope and intensity: some restrict exports outright, while others operate through quotas, licensing requirements or controlled reopening of trade.
China, for example, initially tightened controls on several fertilizer products and inputs, including urea and sulphuric acid, before later allowing limited urea exports under a quota system. The Russian Federation extended export quotas for fertilizers and suspended export licences for ammonium nitrate, while Türkiye introduced a temporary ban on sulphur exports. Because sulphur and sulphuric acid are important inputs for phosphate fertilizers, such measures can affect fertilizer availability even when they do not directly target finished fertilizer products.3
Recent analysis by the International Food Policy Research Institute (IFPRI) finds that, in the current context, restricting fertilizer exports could lead to increased global prices.
How have tariffs affected fertilizer markets?
Almost 60% of all WTO members’ fertilizer tariff lines are duty-free, while only around 10% carry applied tariffs above 5%. As Figure 7 shows, applied fertilizer tariffs tend to be low (below 2.5% for all product groups), although some economies have taken steps to ease imports following the outbreak of the conflict in the Gulf.
The applied tariffs are also low when compared to bound tariffs – the maximum permitted ceilings on tariffs that WTO members have agreed to respect. Nearly 80% of members’ fertilizer tariff lines have bound levels above 5%; over 40% of them have bound levels above 20%; and around one in five tariff subheadings remain unbound.
Among measures identified recently by AMIS, the European Union has suspended fertilizer import tariffs, except for goods from the Russian Federation and Belarus, while Türkiye has lifted duties on urea and other fertilizer categories.
Figure 7: Applied tariffs on fertilizers tend to be very low
Source: OMC
How have subsidies related to fertilizer use and production evolved?
Many economies subsidise the use of agricultural inputs, such as fertilizers, in order to reduce farmers’ production costs.4
As the recent spike in agricultural input prices has not yet been matched by increases in agricultural commodity prices, many farmers worldwide risk facing significant erosion of their margins. Several economies have therefore introduced short-term financial support measures to help farmers mitigate higher production costs, including for fertilizers, as well as longer-term measures to support domestic fertilizer production and promote their more efficient use. At the same time, such measures are aimed at limiting the pass through of higher costs to prices paid by consumers that would further strain food affordability and security (see Box 2).
|
Box 2: Fertilizers trade and food security Because fertilizers are critical for agricultural production, supply disruptions can impair crop yields, ultimately affecting the availability and accessibility of food. However, the consequences of the conflict in the Gulf region for food security depend on several factors, including the availability of fertilizer stocks, how dependent a region is on imports from the Gulf, and other factors affecting production and fertilizer import patterns, such as the El Niño event which is expected to intensify in the coming months. The conflict in the Gulf region may also have had consequences for food security through channels other than the supply shock. Energy supply disruptions can affect the entire food value chain, contributing to domestic price inflation, diminishing the purchasing power of low-income consumers, and exacerbating pre-existing challenges. Higher energy prices have also increased demand for biofuels, raising feedstock prices. Economies in the Gulf region are vulnerable to supply shocks due to their reliance on imported food and feed products. Furthermore, migrant workers employed in the Gulf may face consequences due to a decline in economic activity as a result of the conflict, potentially leading to diminished remittance flows and household incomes in several developing economies. Finally, the humanitarian situation has also deteriorated in neighbouring economies due to the war. Further information |
AMIS has reported that the European Commission adopted a Fertilizer Action Plan, supported by a EUR 540 million financial package under its agriculture crisis reserve, to support EU farmers facing high fertilizer costs. It followed the adoption of a temporary state aid framework to support agriculture and other sectors affected by the Middle East conflict. In this context, Spain has introduced state aid support amounting to EUR 500 million, while France has announced an allocation of up to EUR 145 million, partially drawn from the crisis reserve. Both initiatives are designed to mitigate higher fertilizer prices faced by farmers.
India supports farmers’ use of fertilizers through a urea subsidy scheme and a nutrient-based subsidy scheme applicable to phosphate, potash and non-urea nitrogen containing fertilizers. Subsidy rates under the latter scheme, worth US$ 4.5 billion, were recently revised for the kharif (monsoon) crop season. India has also prioritized the fertilizer sector for natural gas allocation, ensuring that fertilizer plants receive at least 70% of their average natural gas consumption.
Other economies have also announced measures related to fertilizers in recent months. These include the United States, which announced plans to expand domestic fertilizer production, as well as Kenya, Ghana, Sri Lanka, Armenia and Thailand, which have increased their budgets for the distribution of subsidized fertilizers to farmers.
Many economies are also seeking to promote more efficient, sustainable fertilizer use, and support alternatives ranging from organic fertilization and circular farming to innovative technologies such as green ammonia.
Ways forward
Progress towards reopening the Strait of Hormuz will help stabilize global markets for fertilizers – and could also enable WTO members to ease recently-introduced restrictions on trade. In addition, policy responses should take into consideration the particular vulnerability of certain developing economies, notably in Asia and Africa.
Annex Table A1 – Breakdown by category of nutrients by HS code
Nitrogenous-related fertilizers (N)
| Product | HS code | % in category |
|---|---|---|
| Urea | 3102.10 | 100 % |
| Ammonium sulphate | 3102.21, 3102.29 | 100 % |
| Ammonium nitrate | 3102.30 | 100 % |
| Calcium ammonium nitrate and other mixtures with calcium carbonate | 3102.40 | 100 % |
| Sodium nitrate | 3102.50 | 100 % |
| Urea and ammonium nitrate solutions | 3102.80 | 100 % |
| Ammonia, anhydrous | 2814.10 | 100 % |
| Other nitrogenous fertilizers, n.e.c | 2814.20, 3102.60, 2827.10, 2834.10, 3102.29, 3102.90, 3102.70 (HS 92-02) | 100 % |
| NPK fertilizers | 3105.20 | 33.3 %5 |
| in tablets or similar forms or in packages not exceeding 10 kg and other | 3105.10, 3105.90 | 33.3 %5 |
| Other NP compounds | 3105.51, 3105.59 | 50 %5 |
Phosphatic-related fertilizers (P2O5)
| Product | HS code | % in category |
|---|---|---|
| Phosphate rock | 2510 | 100 % |
| Superphosphates above 35% | 3103.10, 3103.11 (HS17) | 100 % |
| Superphosphates, other | 3103.19 (HS17) | 100 % |
| Other phosphatic fertilizers n.e.c. | 3103.90, 3103.20 (HS 92-02) | 100 % |
| Diammonium phosphate | 3105.30 | 100 % |
| Monoammonium phosphate | 3105.40 | 100 % |
| NPK fertilizers | 3105.20 | 33.3 %5 |
| in tablets or similar forms or in packages not exceeding 10 kg and other | 3105.10, 3105.90 | 33.3 %5 |
| Other NP compounds | 3105.51, 3105.59 | 50 %5 |
| PK compounds | 3105.60 | 50 %5 |
Potassic-related fertilizers (K2O)
| Product | HS code | % in category |
|---|---|---|
| Potassium chloride (muriate of potash) | 3104.20 | 100 % |
| Potassium sulphate (sulphate of potash) | 3104.30 | 100 % |
| Other potassic fertilizers, n.e.c. | 3104.90, 3104.10 (HS 92-02) | 100 % |
| Potassium nitrate | 2834.21 | 100 % |
| NPK fertilizers | 3105.20 | 33.3 %5 |
| in tablets or similar forms or in packages not exceeding 10 kg and other | 3105.10, 3105.90 | 33.3 %5 |
| PK compounds | 3105.60 | 50 %5 |
#OMC #Blog #Datos #Blog

 English
  简体中文
简体中文  繁體中文
繁體中文  Français
  Español
  Deutsch
  Русский
  日本語
日本語  한국어
한국어  العربية